


Why Africa's Fragmented Payment Systems Are a Business Infrastructure Problem
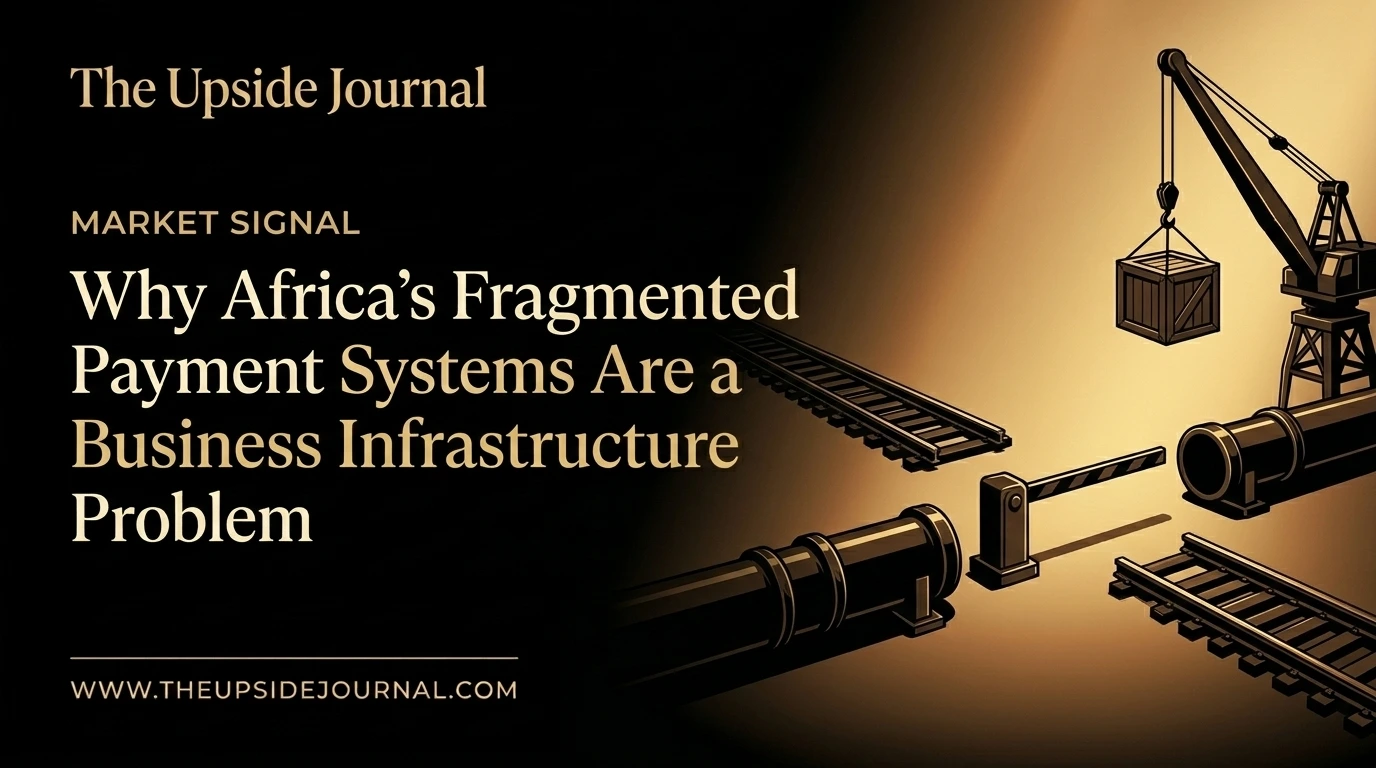
Africa's fragmented payment systems are usually described as a consumer-fintech inconvenience: sending money across a border is slow and expensive. That is directionally true and analytically thin, be
Executive Summary
Africa's fragmented payment systems are usually described as a consumer-fintech inconvenience: sending money across a border is slow and expensive. That is directionally true and analytically thin, because the cost lands on businesses. Two dated data points frame the signal. The Mo Ibrahim Foundation, as reported by The East African on 14 May 2026, states that currency conversions alone cost the continent US$5 billion a year. Business Day reported on 17 July 2026 that intra-African trade runs at about 14% to 16% of total trade, against about 60% for Europe and Asia.
Read together, they describe an infrastructure tax paid by the firm that tries to operate across borders. Interoperability is the remedy being built, and its coverage is the open variable.
What Does Payment-System Fragmentation Mean?
Payment-system fragmentation is the condition in which national payment systems, currencies and regulators do not connect directly, so a cross-border payment has to be routed through intermediaries. This publication's profile of a second cross-border payments founder, published on 1 October 2026, describes African financial systems as "national and fragmented," each with its own currency, regulator and payment schemes.
The IMF's September 2022 Finance & Development article puts a number on the routing. As of 2017, only about 12% of intra-African payments were cleared within the continent, according to SWIFT data the IMF cites, with the rest routed through overseas banks. That figure is nine years old and is cited as history, not as the current position.
The verdict: fragmentation is a routing fact before it is a pricing problem, and the routing sends most intra-African payments outside the continent to settle.
Where Does the Cost Appear?
The same IMF article estimates that routing payments through overseas banks adds US$5 billion a year to intra-African currency transaction costs, and gives one illustration: a payment of US$100 from Ghana to a lawyer in Nigeria took two weeks and cost almost US$40. On those inputs the fee was close to 40% of the sum sent, a calculation from the IMF's own example, which is one payment and not an average.
The Mo Ibrahim Foundation's report "Africa on the Move: Boosting Mobility and Connectivity," reported by The East African on 14 May 2026, states that "currency conversions alone are costing the continent $5 billion every year." The page read gives no methodology and no period beyond the year.
The two US$5 billion figures coincide but should not be treated as one measurement or added together. The IMF's 2022 estimate concerns the cost added by routing through overseas banks; the Foundation's 2026 statement concerns currency conversion. Neither source read publishes its method, so each figure is attributed, not asserted.
The verdict: the cost is large in both estimates, but the evidence supports its direction more firmly than its size.
Who Pays the Cost?
The operating firm pays. In the Business Day report of 17 July 2026, Muntanga Lindunda, chief executive of the Zambia Association of Manufacturers, said that not all banks are on the Pan-African payment system, which raises currency risks. Ola Oyetayo, chief executive of the fintech Verto, said that in some cases paying a major international financial centre is simpler than settling a transaction within Africa.
Oyetayo named the mechanism: "Liquidity remains the core issue." Businesses, he said, need deep emerging-market foreign exchange, multicurrency accounts and a direct route to foreign-currency rails, and without them payments take longer and working capital is tied up. Each cross-border sale therefore carries a conversion, a delay and a working-capital lock-up.
The sources read do not itemise who collects the fees that routing adds, so no beneficiary is named here. The founder context for one company built on this friction is in this publication's 22 September profile of GB Agboola.
The verdict: the buyer of the payment is not the only payer, because the firm that sells across a border funds the delay as well as the fee.
What Does the Trade Share Show?
The IMF article reports that trade among Africa's 55 countries is about 15% of total trade, against an estimated 60% for Asia and roughly 70% for the EU. Business Day, in July 2026, reported African intra-trade at about 14% to 16%, against about 60% for Europe and Asia, attributing the figures to a manufacturing conference in Johannesburg without naming the speaker. The two sources give different European comparators, 70% in 2022 and 60% in 2026, and each is cited with its own date.
On either set, the African share is about a quarter of the Asian comparator, a calculation from 15 divided by 60. The pairing does not prove that routing causes the gap: the Business Day article concerns border bottlenecks more broadly, and logistics and demand also limit trade. The signal is that the two measures move together: a high conversion cost sits beside a low intra-trade share.
The verdict: payment routing is one named constraint on cross-border commerce, and the trade data show the outcome without isolating the cause.
What Is Being Built, and How Far Does It Reach?
Interoperability is the remedy. The Pan-African Payment and Settlement System, known as PAPSS, describes itself as a cross-border financial market infrastructure that settles payments in local currencies, supported by Afreximbank, the African Union and the African Continental Free Trade Area. The IMF recorded its formal launch in January 2022 and reported that, by midsummer 2022, six central banks and 16 commercial banks were integrated and no commercial transaction had yet been completed.
Coverage is now larger, and the counts differ because they measure different things. In a 9 July 2026 joint announcement issued under PAPSS's name, the Bank of Central African States said it had joined PAPSS, which PAPSS said connects 28 African countries, 16 payment switches and more than 190 commercial banks and fintechs. PAPSS's own June 2026 coverage document lists 14 countries with live send-and-receive participants, a count taken from the list because no total is stated. It also describes availability in over 20 countries and 31 as reachable, including an inbound-only extended network.
Connected, live and reachable are three different statuses. Lindunda's remark that not all banks are on the system shows that the gap between them is the commercial question. The layer where a domestic payment product becomes a continental one, or fails to, is cross-border connectivity, which this publication's payments-stack analysis describes.
The verdict: interoperability exists as infrastructure, and what remains uncertain is how many of a merchant's own banks sit on the live part of it.
Why This Matters for Operators and Capital Allocators
Applied to the two dated figures, the formula reads as follows. They say that a US$5 billion annual conversion cost and an intra-trade share near 15% are reported for 2026. They mean that routing, not only demand, limits cross-border commerce. Merchants benefit if interoperability reaches their banks, and infrastructure operators benefit if they standardise the rails. The economic consequence is that a business unable to settle in-region at low cost has a smaller addressable market than its product implies.
For an operator, the practical question is where a given corridor sits on the connected, live and reachable scale, and what a conversion and a delay add to the price of the next cross-border contract. The 20 August 2026 analysis of diaspora payment networks names regulatory fragmentation and interoperability gaps among four obstacles, which are the same two constraints seen from the network side.
For a capital allocator, the signal is one input into how large an African business can become before it must build or buy its own rails, the question the Diaspora Operators pillar develops and a later operator playbook in this series takes up.
The verdict: fragmentation caps the size of a cross-border business before demand does.
Key Takeaways
- Payment-system fragmentation is a business-infrastructure constraint, not a consumer inconvenience, because the firm selling across a border funds the conversion, the delay and the locked-up working capital.
- The two reported US$5 billion figures, the IMF's 2022 estimate for overseas routing and the Mo Ibrahim Foundation's 2026 statement for currency conversion, measure different things and cannot be added or treated as current fact without their dates and attribution.
- Intra-African trade near 15% against about 60% for Europe and Asia shows the outcome of the constraint, not its sole cause.
- PAPSS coverage depends on the definition used, since connected, live send-and-receive and reachable counts differ, and the live part is the one a merchant can use.
- Interoperability reaching a merchant's own banks is the variable that decides whether the infrastructure tax falls.
Conclusion
Two dated figures describe a cost paid by businesses and a trade share that stays low. Interoperability is under construction, and its live coverage is the number to track. Fragmented rails impose an infrastructure tax on businesses trying to operate across borders.
External References
- PAPSS: Pan-African Payment and Settlement System
- IMF Finance & Development: Freeing Foreign Exchange in Africa
- PAPSS and Bank of Central African States: Joint announcement on the Bank of Central African States joining PAPSS
- The East African: Mo Ibrahim: Africa loses $5bn in currency conversion costs
- Business Day: Five years on, border bottlenecks are still slowing Africa's free trade push